Pular para o conteúdo principal

Grafos/DadosConectados na Visão do Gartner

Gartner Identifies Top 10 Data and Analytics Technology Trends for 2019

 Trend No. 5: Graph

Graph analytics is a set of analytic techniques that allows for the exploration of relationships between entities of interest such as organizations, people and transactions.

The application of graph processing and graph DBMSs will grow at 100 percent annually through 2022 to continuously accelerate data preparation and enable more complex and adaptive data science. 

Graph data stores can efficiently model, explore and query data with complex interrelationships across data silos, but the need for specialized skills has limited their adoption to date, according to Gartner.

Graph analytics will grow in the next few years due to the need to ask complex questions across complex data, which is not always practical or even possible at scale using SQL queries.


Gartner Identifies Top 10 Data and Analytics Technology Trends for 2020

Trend 4: X Analytics

Gartner coined the term “X analytics” to be an umbrella term, where X is the data variable for a range of different structured and unstructured content such as text analytics, video analytics, audio analytics, etc.

During the COVID-19 pandemic, AI has been critical in combing through thousands of research papers, news sources, social media posts and clinical trials data to help medical and public health experts predict disease spread, capacity-plan, find new treatments and identify vulnerable populations. X analytics combined with AI and other techniques such as graph analytics will play a key role in identifying, predicting and planning for natural disasters and other crises in the future.

Trend 10: Relationships Form the Foundation of Data and Analytics Value

By 2023, graph technologies will facilitate rapid contextualization for decision making in 30% of organizations worldwide. Graph analytics is a set of analytic techniques that allows for the exploration of relationships between entities of interest such as organizations, people and transactions. It helps data and analytics leaders find unknown relationships in data and review data not easily analyzed with traditional analytics.


Comentários

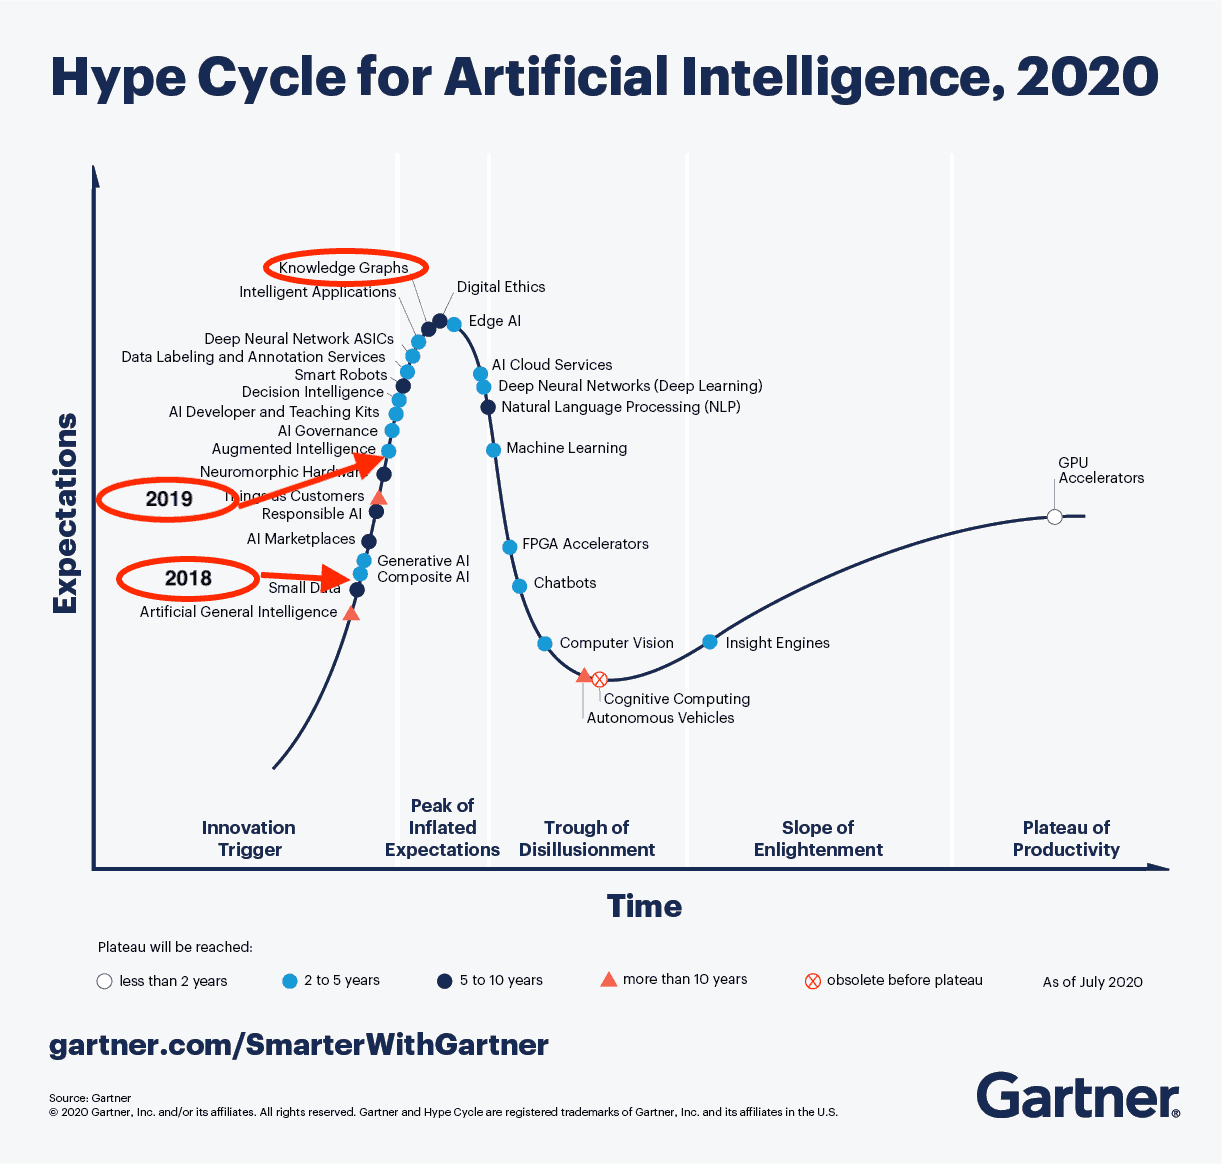
  1. O Gartner faz anualmente análises de mercado em determinados segmentos. Em 2019 e 2020, grafos de conhecimento estão em evidência.

    ResponderExcluir

Postar um comentário

Sinta-se a vontade para comentar. Críticas construtivas são sempre bem vindas.

Postagens mais visitadas deste blog

Connected Papers: Uma abordagem alternativa para revisão da literatura

Durante um projeto de pesquisa podemos encontrar um artigo que nos identificamos em termos de problema de pesquisa e também de solução. Então surge a vontade de saber como essa área de pesquisa se desenvolveu até chegar a esse ponto ou quais desdobramentos ocorreram a partir dessa solução proposta para identificar o estado da arte nesse tema. Podemos seguir duas abordagens:  realizar uma revisão sistemática usando palavras chaves que melhor caracterizam o tema em bibliotecas digitais de referência para encontrar artigos relacionados ou realizar snowballing ancorado nesse artigo que identificamos previamente, explorando os artigos citados (backward) ou os artigos que o citam (forward)  Mas a ferramenta Connected Papers propõe uma abordagem alternativa para essa busca. O problema inicial é dado um artigo de interesse, precisamos encontrar outros artigos relacionados de "certa forma". Find different methods and approaches to the same subject Track down the state of the art rese...

Knowledge Graph Embedding with Triple Context - Leitura de Abstract

  Jun Shi, Huan Gao, Guilin Qi, and Zhangquan Zhou. 2017. Knowledge Graph Embedding with Triple Context. In Proceedings of the 2017 ACM on Conference on Information and Knowledge Management (CIKM '17). Association for Computing Machinery, New York, NY, USA, 2299–2302. https://doi.org/10.1145/3132847.3133119 ABSTRACT Knowledge graph embedding, which aims to represent entities and relations in vector spaces, has shown outstanding performance on a few knowledge graph completion tasks. Most existing methods are based on the assumption that a knowledge graph is a set of separate triples, ignoring rich graph features, i.e., structural information in the graph. In this paper, we take advantages of structures in knowledge graphs, especially local structures around a triple, which we refer to as triple context. We then propose a Triple-Context-based knowledge Embedding model (TCE). For each triple, two kinds of structure information are considered as its context in the graph; one is the out...

KnOD 2021

Beyond Facts: Online Discourse and Knowledge Graphs A preface to the proceedings of the 1st International Workshop on Knowledge Graphs for Online Discourse Analysis (KnOD 2021, co-located with TheWebConf’21) https://ceur-ws.org/Vol-2877/preface.pdf https://knod2021.wordpress.com/   ABSTRACT Expressing opinions and interacting with others on the Web has led to the production of an abundance of online discourse data, such as claims and viewpoints on controversial topics, their sources and contexts . This data constitutes a valuable source of insights for studies into misinformation spread, bias reinforcement, echo chambers or political agenda setting. While knowledge graphs promise to provide the key to a Web of structured information, they are mainly focused on facts without keeping track of the diversity, connection or temporal evolution of online discourse data. As opposed to facts, claims are inherently more complex. Their interpretation strongly depends on the context and a vari...